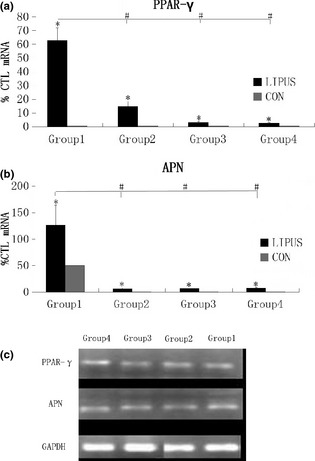
Figure 2.

Low‐intensity pulsed ultrasound ( LIPUS ) promoted PPAR‐γ1 and APN transcription after adipogenic induction. (a) In all groups, PPAR‐γ1 mRNA was detected by real‐time PCR. Data obtained indicated that mRNA level of PPAR‐γ1 Group 1 was significantly higher than that of other groups, and there was no statistically significant differences between data of Groups 2–4. (b) In all groups, APN mRNA was detected by real‐time PCR. Data obtained indicated that mRNA level of APN group 1 was significantly higher than that of the other groups, and there was no statistically significant difference between data of Groups 2–4. P values <0.05 were considered statistically significant, as indicated by * (Dunnett t‐test) and # (LSD t‐test), * for comparison between different groups on the same day, and # for comparison between different groups 2 + 5D, 2 + 3D, 5D and 3D. (c) RT‐PCR showed expression of PPAR‐γ1 and APN.
