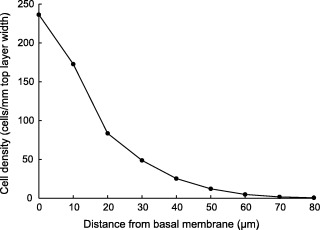
Figure 2.

Positional cell density in mouse ventral tongue using data as in Table 1 . The cell density is expressed as cells per mm top layer width. Each distance value sums up the cells in distances of ±5 µm of the printed value, measured from the basal membrane. Thus the first region is only 5 µm thick; this region contains almost only basal cells.
