
Figure 7.
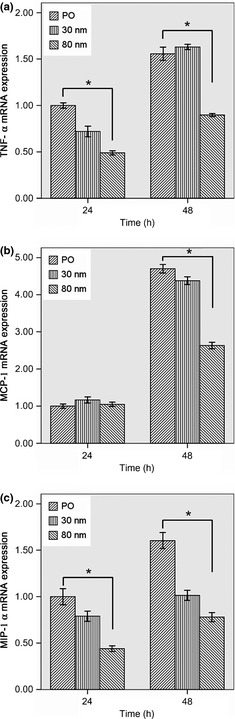
Evaluation of TNF‐α, MCP‐1 and MIP‐1α mRNA levels of macrophages cultured on the various sample surfaces after 24 and 48 h. (a) TNF‐α mRNA expression; (b) MCP‐1 mRNA expression; (c) MIP‐1α mRNA expression. Error bars represent the standard deviation for three specimens for each piece of data. *Statistical significance (P < 0.05).