
Figure 3.
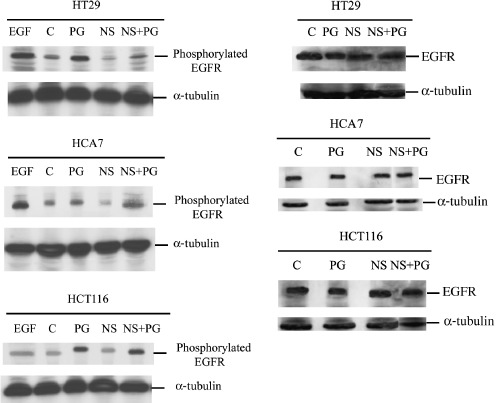
Effect of PGE2 (1 µm) and NS398 (10 µm) on EGFR activation and EGFR total protein levels. Lysates of 2 × 10⁶ cells from untreated (C), PGE2 (PG)‐, NS‐398 (NS)‐ and PGE2+ NS‐398 (NS+PG)‐treated 24 h samples were prepared. EGF (0.6 µg/mL) was used as control for the EGFR activated form. Samples were resolved by sodium dodecyl sulphate‐polyacrylamide gel electrophoresis, probed with anti‐EGF receptor (activated) monoclonal antibody and anti‐EGF receptor monoclonal antibody. Protein levels were determined by Western immunoblotting (185 kDa). Equal loading is shown by repeat probing with anti‐α‐tubulin.