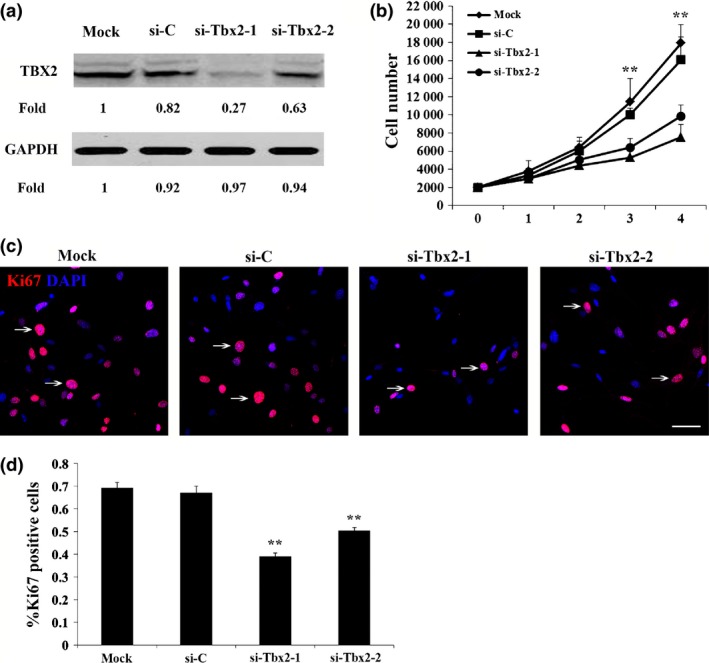
Figure 3.

Knockdown of Tbx2 inhibited melan‐a cell proliferation. (a) Western blot analysis of TBX2 expression using anti‐TBX2 antibody. Note that expression of TBX2 was significantly reduced in melan‐a cells transfected with Tbx2‐specific siRNAs (si‐Tbx2‐1 and si‐Tbx2‐2). Intensity of bands was measured using ImageJ software and fold‐change was normalized to that of mock cells. (b) Proliferation analysis for melan‐a cells transfected with si‐C, si‐Tbx2‐1 or si‐Tbx2‐2. Cell numbers were recorded from day 1 to day 4 after transfection. Note that knockdown of Tbx2 led to reduced cell growth compared to mock cells. (c) Immunolabelling for Ki67 (red nuclear staining), a marker for proliferating cells, in melan‐a cells transfected with si‐C, si‐Tbx2‐1 or si‐Tbx2‐2. Number of Ki67‐positive cells was reduced in Tbx2 knockdown cells after 3 days transfection by si‐Tbx2. Bar = 50 μm. (d) Percentage of Ki67‐positive cells was determined based on data similar to those shown in Fig. 2c. Data are from triplicate experiments and are represented as mean ± SD. **P < 0.01.
