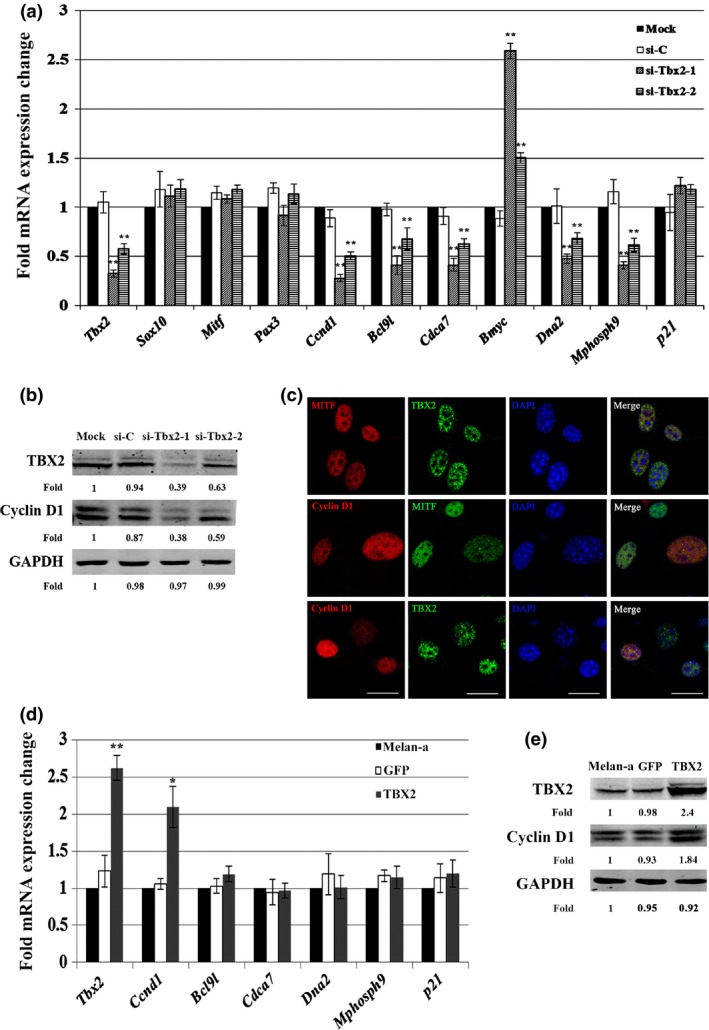
Figure 4.

Tbx2 regulated expression of endogenous Ccnd1 . Knockdown of Tbx2 led to down‐regulation of Ccnd1 expression (a, b). (a) Relative fold change in mRNA levels of candidate proliferation‐related genes in melan‐a cell transfected with si‐Tbx2‐1 or si‐Tbx2‐2 compared to mock cells. Down‐regulation of Tbx2 caused reduction of several proliferation‐related genes, including Ccnd1, Bcl9l, Cdca7, Mphosph9, and Dna2. (b) Western blot analysis of TBX2 and Cyclin D1 expression in melan‐a cell transfected with si‐C, si‐Tbx2‐1 or si‐Tbx2‐2. Note that knockdown of Tbx2 lead to reduction in levels of Cyclin D1, consistent with reduction in Tbx2 mRNA seen in (a). Intensity of bands was measured using ImageJ software and fold‐change compared to level seen in mock cells is indicated. (c) Immunolabelling for TBX2, Cyclin D1, and MITF in melan‐a cells showed that TBX2 and Cyclin D1 colocalized in nuclei of melan‐a cells. Bar = 20 μm. (d, e) Overexpression of TBX2 up‐regulated expression of Ccnd1. Melan‐a cells were infected with the GFP or GFP‐TBX2 lentivirus, respectively, and cells were continually cultured for at least a week. (d) Relative fold‐change in mRNA levels of candidate proliferation‐related genes in melan‐a cells overexpressing TBX2. Results show that overexpression of TBX2 lead to up‐regulation of Ccnd1. (e) Western blot analysis of TBX2 and Cyclin D1 expression in TBX2‐overexpressing melan‐a cells. Note that expression of Cyclin D1 increased after overexpression of Tbx2. Intensity of bands was measured using ImageJ software and fold‐change was compared to expression in mock cells. Data for (a) and (d) are from triplicate experiments and are represented as mean ± SD. *P < 0.05 and **P < 0.01.
