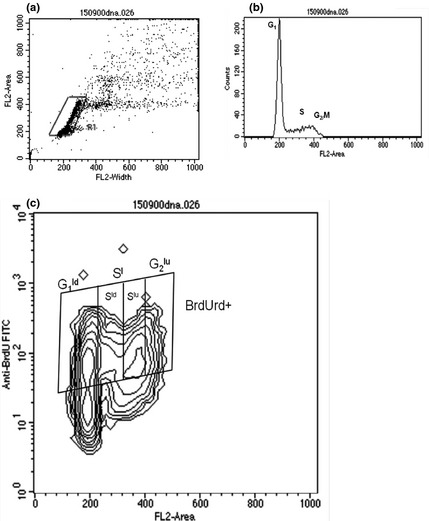
Figure 1.

(a) Dot plot of IP‐W versus IP‐A parameters (DNA content) to select population of spleen cells, discriminating doublets. (b) Histogram of DNA content versus cell frequency where peaks correspond to cells in G1, S and G2/M phases. (c) Contour plot indicating cells in different phases of the cell cycle and cells that incorporated BrdUrd during the process of DNA synthesis. Figure is of cells from WN rat pups.
