
Figure 3.
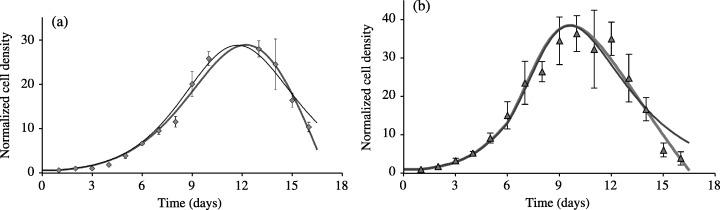
Improved fit to the experimental data when considering the additional effect of medium toxicity on cell death. Data in Fig. 3a correspond to assay 3 and to cell densities measured when using 5% FCS medium with medium change occurring at day 3, while the experimental data of Fig. 3b correspond to the cell densities measured in assay 4 with medium changes occurring at days 3 and 6. Experimental data are expressed as mean ± SD of cell densities counted in three different wells. Thin solid lines are the results of the fit to the data using the ND model (Table 1), while thick solid lines show the results of the fitted data using the NDTD model (Table 2). The NDTD model gives an improved description of the sharp decrease in cell densities at the end of the experimental period.