
Figure 4.
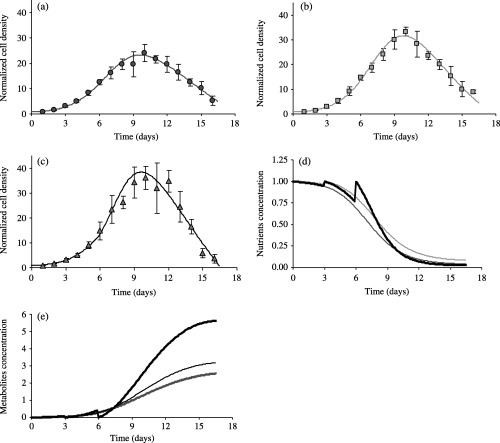
Robustness of the NDTD model predictions with regard to changes of the cell culture microenvironment. EAhy926 cells, initially from the same subpopulation, were cultured in standard conditions but then experienced different culture conditions: no change of the cell culture medium (a), medium change at day 3 after plating (b) or at days 3 and 6 after plating (c). Data are expressed as mean ± SD of cell densities counted in three different wells. The solid lines are the best‐fit curves of the NDTD model. Corresponding simulated evolution curves of the nutrient concentrations are plotted in (d). Resets of nutrient concentration to initial values correspond to the days where culture medium changes have been imposed. These resets are also visible on the curves showing the increase of the toxic metabolites concentrations p(t) with time (e). The successive curves corresponds to – medium changes at days 3 and 6 (top thick solid line) – medium change at day 3 (intermediate thin solid line), – no medium change (lower thick solid line).