
Figure 6.
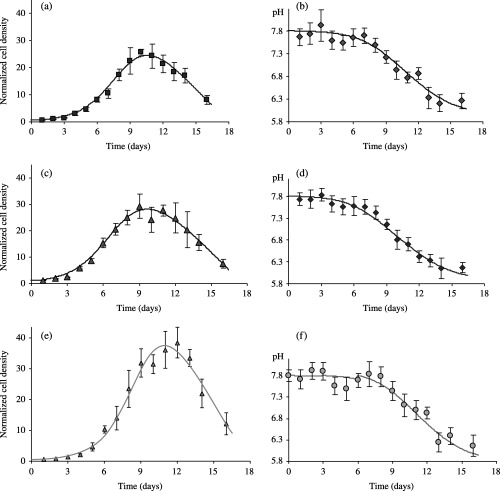
pH‐sensitive proliferation of EAhy926 endothelial cells. Cell numbering and measurements of cell culture medium pH were realized both in standard culture conditions already considered in Fig. 1 (no medium change, 10% FCS, plating density 15.103 cells/cm2) (a and b) and for two different modifications of this standard protocol, namely doubling cell plating density (30.103 cells/cm2) (c and d) or changing the culture medium at day 3 and day 6 after plating (e and f). The NDpHD model accounts very satisfactorily for the correlation between pH‐variation and the multiphasic aspect of the three‐different cell proliferation patterns, as indicated by the best‐fit curves (solid lines) obtained when simultaneously fitting cell densities and pH experimental data. Corresponding model parameters are given in Table 3. Data are expressed as mean ± SD of cell densities counted in three different wells.