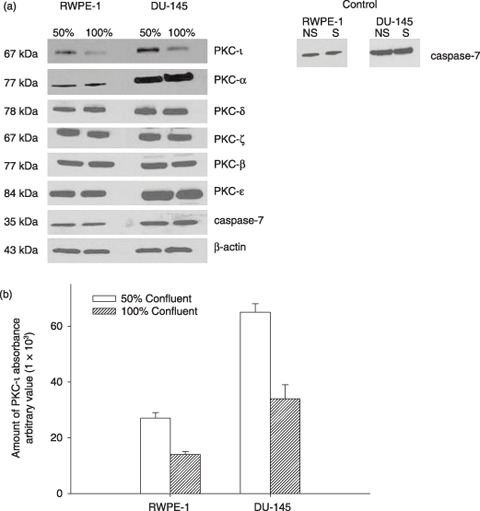
Figure 1.

(a) Effect of cell density and cell‐cycle progression on PKC‐ι expression in RWPE‐1 cells and DU‐145 cells. FACS analysis of average DNA content in cell‐cycle distribution is shown in Table 1 . Serum starvation caused cell‐cycle arrest in both rapidly dividing cells (50% confluent) and contact‐inhibited (100% confluent) cells. (a) Western blotting of PKC isoforms was performed as described in the Materials and methods section. Immunoblots of PKC‐ι show fluctuations between 50% and 100% confluent cells. Randomly chosen PKC isoforms (α, δ, ζ, β, ɛ) depict no significant changes between 50% and 100% confluent cells. Inactivated caspase‐7 indicates survival in both cells. Non‐starved (NS) and serum starved (S) at 100% confluent cells. Western blotting of β‐actin indicates equal loading of protein in each lane. (b) Densitometry for PKC‐ι absorbance was calculated from three independent Western blots obtained from three independent experiments. Absorbance, mean and standard deviation were plotted. Average cell‐cycle distribution is shown in Table 1.
