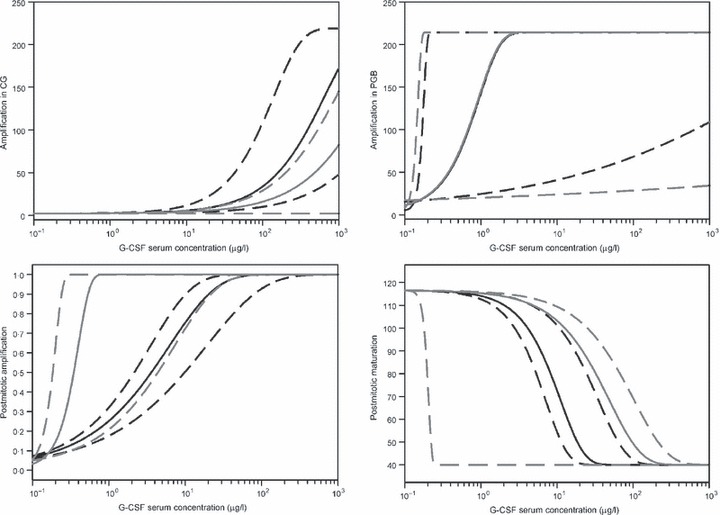
Figure 5.

Estimated regulation functions for Maxy‐G34 (black) and pegfilgrastim (grey) in a range of G‐CSF serum concentrations supported by measurements. Solid lines are based on parameter estimates resulting in optimal agreement between model and data. Dotted lines indicate a confidence range of the regulation function based on parameter settings resulting in less than 10% deviation from optimal fitness. G‐CSF, granulocyte colony‐stimulating factor.
