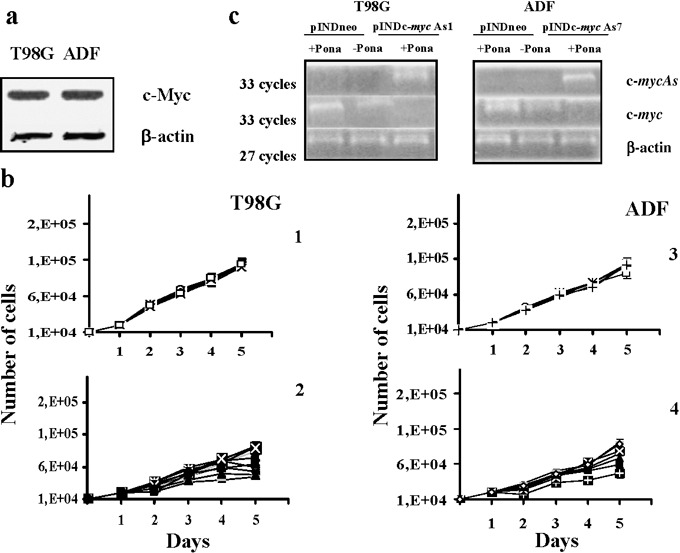
Figure 1.

(a) Western blot analysis of c‐Myc protein expression on both T98G and ADF cell lines. Each lane was loaded with 70 µg of proteins from cell lysate. Protein levels were quantified by densitometric analysis (TotalLab image analysis solution, version 2003) and normalized for β‐actin. The experiment was repeated three times showing similar results. (b) Growth curves of both T98G and ADF pINDneo control and pINDc‐myc As clones. pINDneo control clones were transfected with the empty vector (1, 3), and pINDc‐myc As clones (2, 4) were treated with 25 µm of ponasterone given every 24 h. At the indicated times, from day 2 (24 h after induction) to day 5 (96 h after induction), cells were harvested and counted by using the trypan blue dye exclusion test. All data are expressed as means ± standard deviation of three independent experiments with similar results. Statistical significance of data was evaluated by one‐way analysis of variance followed by Tukey post‐hoc test. (c) Representative RT‐PCR analysis of ectopic c‐myc As and endogenous c‐myc in pINDneo control and pINDc‐myc As transfected cells. Clones were exposed for 24 h to 25 µm of ponasterone. c‐myc (Hmyc 01 for ATTCTCTGCTCTCCTCGA; Hmyc02 rev TCTTGGCAGCAGGATAGT); c‐myc As (Hmyc 03 for CTCCTCGTCGCAGTAGAA; BGH rev TAGAAGGCACAGTCGAGG); β‐actin (sense GCGCGGCGTAGCCCCCGTCAG; anti‐sense CGCGGCAGGAAGCCAGGCCCC). β‐actin c‐DNA was used as an internal control. The experiment was repeated three times showing similar results.
