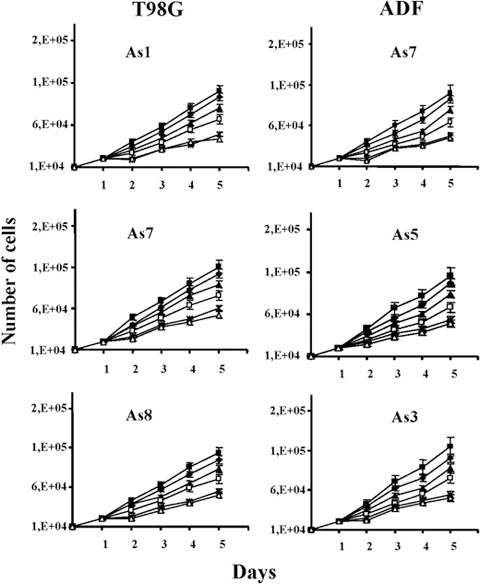
Figure 2.

Determination of the optimal schedule of hormone treatment in both T98G and ADF pINDc‐myc As clones. Cell growth number effects in both T98G and ADF clones exposed to 5 ( ), 10 (
 ), 15 (
 ), 20 (*) and 25 µm (
 ) dosages of ponasterone given every 24 h. As control we used pINDneo (
 ) for each cell line. At the indicated times, from day 2 (24 h after induction) to day 5 (96 h after induction), cells were harvested and counted by using trypan blue dye exclusion. All data are expressed as means ± standard deviation of three independent experiments with similar results. Statistical significance of the data was evaluated by one‐way analysis of variance followed by Tukey post‐hoc test.
