Figure 6.

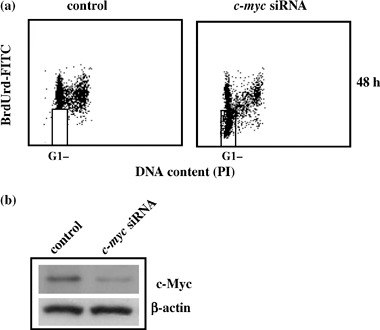
(a) c‐myc siRNA cell cycle profile. The dosage of 10 µm bromodeoxyuridine (BrdUrd) was continuously added to the medium for 48 h, after the end of transfection. c‐myc siRNA sequence (sense, 5′‐AACAGAAAUGUCCUGAGCAAU‐3′). The regions represent BrdUrd‐negative G1 cells. Samples were acquired using a FACScan cytofluorimeter (Becton Dickinson). Biparametric flow cytometry analysis was performed using the CellQuest software package. In the regions BrdUrd‐negative cells are localized. All the experiments were repeated three times showing similar results. (b) c‐myc siRNA Western blot analysis. c‐myc interference was assessed at 48 h. Protein levels were quantified by densitometric analysis (TotalLab image analysis solution, version 2003) and normalized for β‐actin. The experiment was repeated three times showing similar results.
