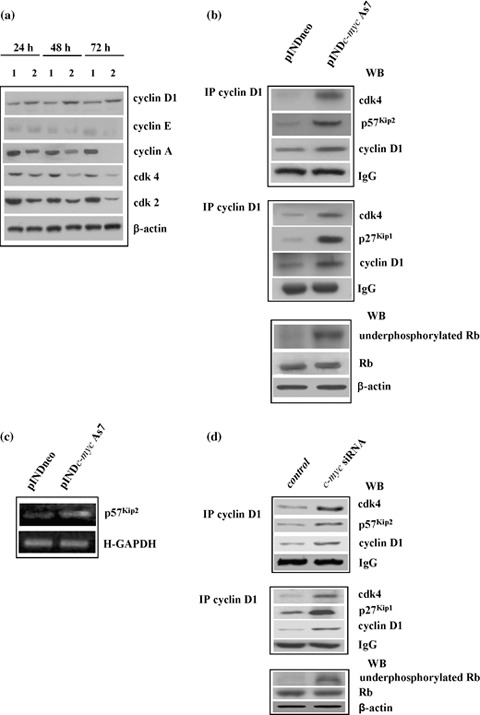
Figure 7.

(a) Western blot analysis of cell cycle‐related proteins. ADF pINDneo control clone (1) and ADF pINDc‐myc As7 clone (2) were treated with 20 µm ponasterone (given every 24 h) 24, 48 and 72 h after treatment. Protein levels were quantified by densitometric analysis (TotalLab image analysis solution, version 2003) and normalized for β‐actin. The experiment was repeated three times showing similar results. (b) Co‐immunoprecipitation analysis. Cyclin D1/cdk4/p57Kip2 “apice” (top panel) and cyclin D1/cdk4/p27Kip1 “apice” (medium panel) tertiary complexes were detected by co‐immunoprecipitation analysis using anti‐cyclin D1 antibody 48 h after 20 µm hormone induction in pINDneo control and ADF pINDc‐myc As7 clones. The bottom panel shows Western blot analysis of active unphosphorylated form and total retinoblastoma protein performed 48 h after 20 µm ponasterone treatment. Protein levels were quantified by densitometric analysis (TotalLab image analysis solution, version 2003) and normalized for β‐actin. The experiment was repeated three times showing similar results. (c) RT‐PCR analysis of total RNA extracted from the control ADF pINDneo clone and the ADF pINDc‐myc As7. Clones were exposed for 24 h to 20 µm of ponasterone. p57Kip2, GenBank accession number U22398 (p57Kip2 for CACGATGGAGCGTCTTGTC; p57Kip2 rev CCT GCTGGAAGTCGTAATCC); H‐GAPDH (H‐GAPDH for GCAGGGGGGAGCCAAAAGGG; H‐GAPDH rev CAGCGCCAGTAGAGGCAGGG). Levels of transcription of p57Kip2 “apice” were normalized versus H‐GAPDH. All the experiments were repeated three times showing similar results. (d) Cyclin D1/cdk4/p57Kip2 “apice” and Cyclin D1/cdk4/p27Kip1 “apice” ternary complexes in siRNA c‐myc cells. Cyclin D1/cdk4/p57Kip2 “apice” (top panel) and cyclin D1/cdk4/p27Kip1 “apice” (medium panel) tertiary complexes were detected by co‐immunoprecipitation analysis using anti‐cyclin D1 antibody at 48 h. The bottom panel shows Western blot analysis of the active unphosphorylated form and total retinoblastoma protein. Protein levels were quantified by densitometric analysis (TotalLab image analysis solution, version 2003) and normalized for β‐actin. The experiment was repeated three times showing similar results.
