
Figure 8.
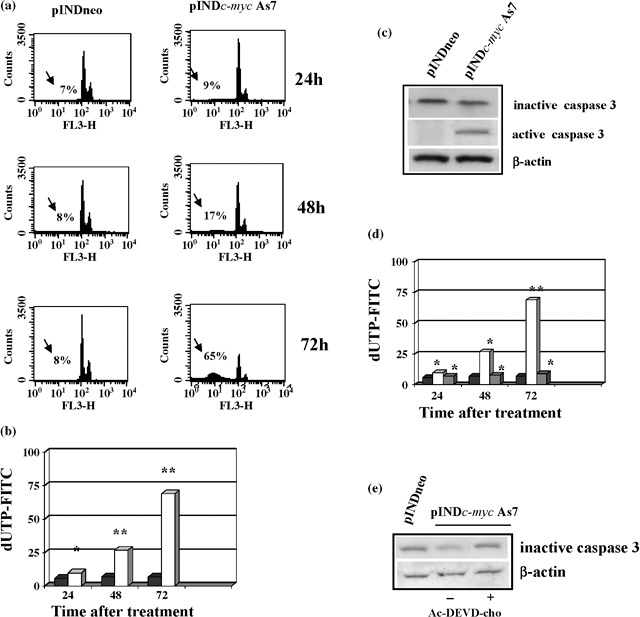
(a) Flow cytometry and apoptosis analysis. ADF pINDneo control cells and ADF pINDc‐myc As7 clone exposed to 20 µm of hormone treatment (given every 24 h) 24, 48 and 72 h after. The sub‐G1 peak (arrows) represents the percentage of apoptosis. (b) TUNEL assay. Percentages of apoptotic cells in ADF pINDc‐myc As7 (white) and pINDneo control cells (black) 24, 48 and 72 h after treatment. Statistical significance between different groups was evaluated by Student's t‐test (**P < 0.001; *P < 0.01). A P‐value < 0.001 was considered significant. (c) Western blot analysis of inactive precursor and active form of caspase‐3. Protein levels were quantified by densitometric analysis (TotalLab image analysis solution, version 2003) and normalized for β‐actin. The experiment was repeated three times showing similar results. (d) Effect of Ac‐DEVD‐cho caspase‐3 inhibitor on apoptosis. Percentages of apoptotic cells in ADF pINDneo control (black), ADF pINDc‐myc As7 in the absence (white) or presence (grey) of 50 µm of Ac‐DEVD‐cho by using TUNEL assay. Statistical significance between the different groups was evaluated by Student's t‐test (**P < 0.001; *P < 0.01). A P‐value < 0.001 was considered significant. (e) The effect of 50 µm of Ac‐DEVD‐cho on caspase‐3 expression by Western blot. Protein levels were quantified by densitometric analysis (TotalLab image analysis solution, version 2003) and normalized for β‐actin. The experiment was repeated three times showing similar results.