
Figure 2.
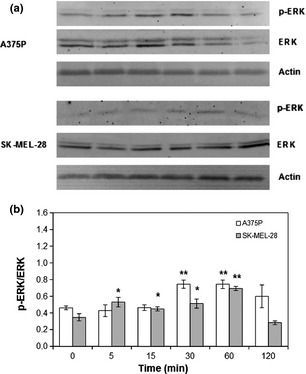
FA ‐induced ERK phosphorylation. A375P cells were treated with 10−5 m FA, while SK‐MEL‐28 cells were treated with 2.5 × 10⁻⁵ m FA. (a) Representative western blot images. (b) Densitometric quantification of ERK phosphorylation. Results represent mean values obtained from three independent experiments and are expressed as mean values ± standard deviation (SD). White bars represent A375P cells, while grey bars are referred to SK‐MEL‐28 cells.