
Figure 5.
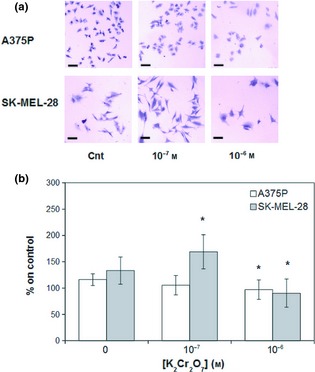
Hexavalent chromium (K 2 Cr 2 O 7 ) effects on A375P and SK ‐ MEL ‐28 cell lines after 24 and 72 h incubation respectively. (a) Representative images (magnification 4×). (b) Quantification of K2Cr2O7 effects on A375P (white bars) and SK‐MEL‐28 (grey bars) cell proliferation. Results represent mean values obtained from three independent experiments and are expressed as mean values ± standard deviation (SD). *P < 0.05, **P < 0.001 compared to control samples.