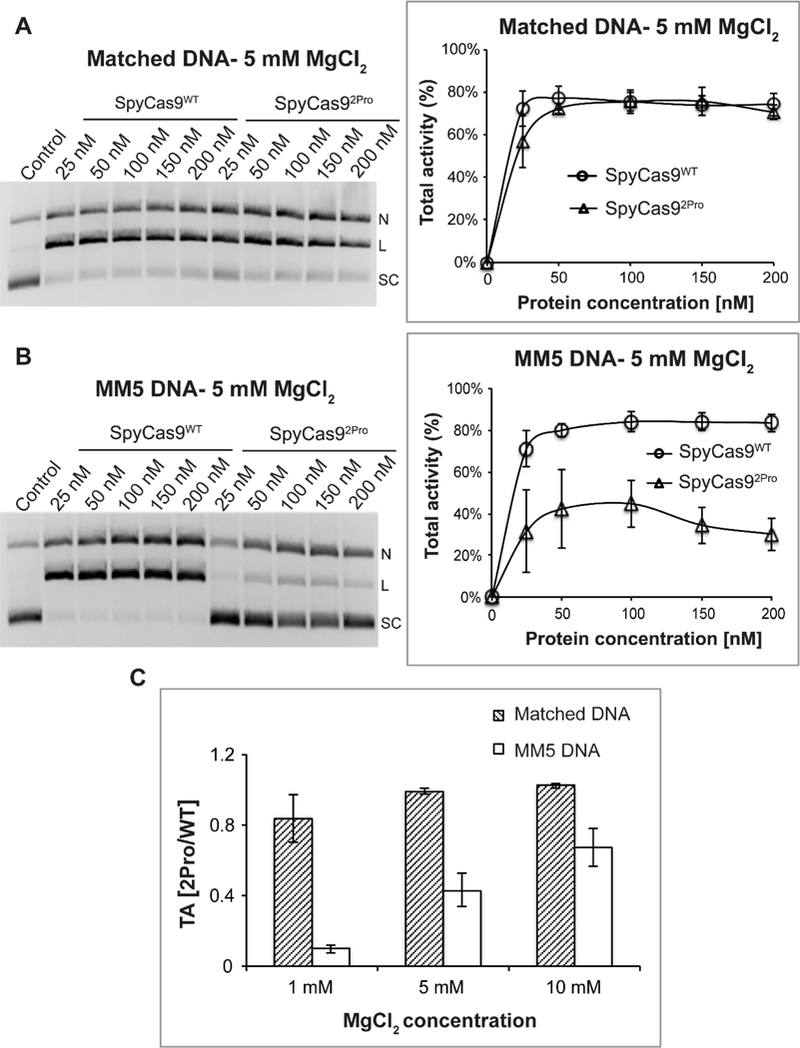
Figure 2. Comparison of SpyCas9WT and SpyCas92Pro activities using different DNA substrates.

A) Total activity with a fully matched DNA substrate at 5 mM Mg2+. Shown on the left is a representative gel presenting the DNA cleavage with varying amounts of protein: sgRNA complex. Supercoiled (SC), linear (L), and nicked (N) DNA bands are indicated. Shown on the right is a plot of the total activity vs. the enzyme complex concentration. Average values from three replications were plotted against protein concentrations to produce a line graph. B) Total activity with a mismatched DNA (MM5) substrate at 5 mM Mg2+. Organization of the panel is the same as that in panel A. C) The averaged ratio of total DNA cleavage activities between SpyCas92Pro and SpyCas9WT, , at different Mg2+ concentrations. For all the panels, data shown were obtained with a reaction time of 15 minutes, and error bars represent standard error mean (SEM). Each experiment was typically conducted in replicates of three, using proteins from two different batches of purification.
