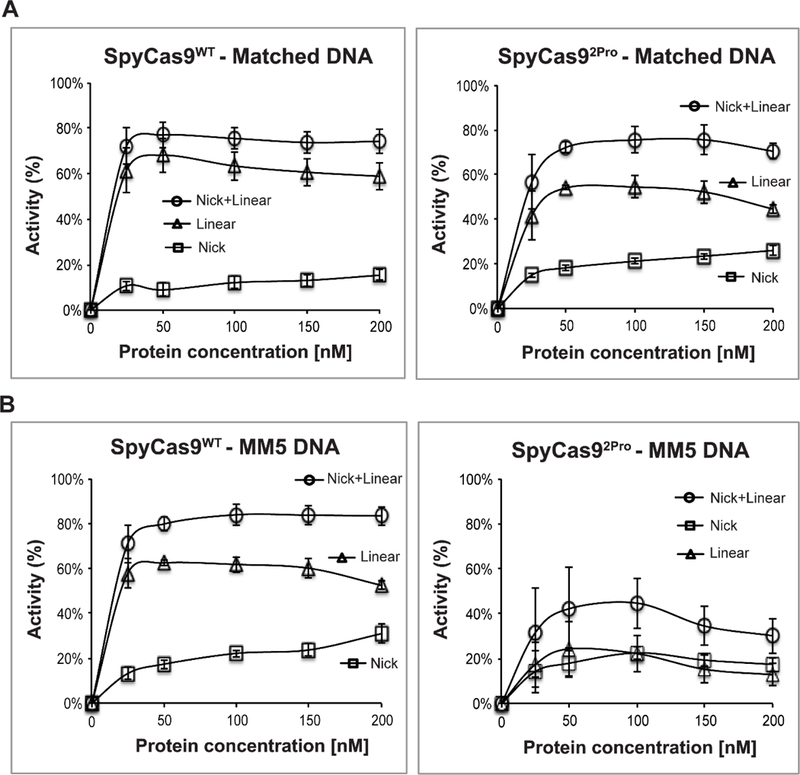
Figure 4. Comparison of the linearization and nicking activities of SpyCas9WT and SpyCas92Pro.

A) Analysis of cleavage pattern of SpyCas9WT (left) and SpyCas92Pro (right) with a fully matched DNA substrate at 5 mM Mg2+ ions. B) Analysis of cleavage pattern of a mismatched (MM5) DNA substrate at 5 mM Mg2+ ions using SpyCas9WT (left) and SpyCas92Pro (right). The average values for nicked (%), linear (%), and nicked + linear (%) (see Materials and Methods) are plotted against protein concentration. Data were obtained from three replications with a reaction time of 15 minutes and error bars represent SEM.
