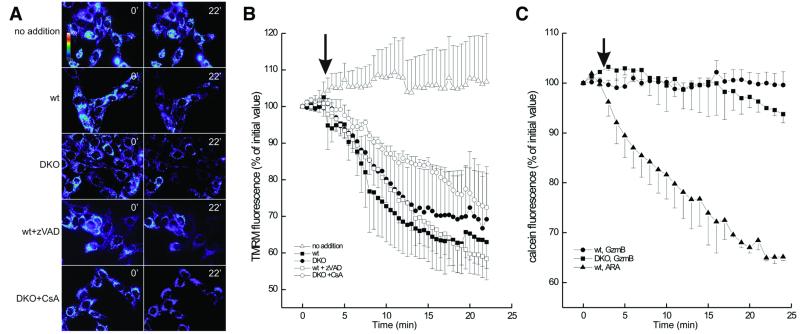
Figure 4.
Real-time imaging of mitochondrial membrane potential and PT in wt and DKO MEFs. (A) Pseudocolor-coded, representative images of TMRM fluorescence intensity in wt and DKO cells at the beginning (time 0′) and at the end (time 22′) of the acquisition sequence. Unless specified, after 3 min, cells were treated with 15 μg of LAK extract plus 6 μg of rGzmB. Where indicated, cells were pretreated for 30 min with 50 μM zVAD-fmk or with 2 μM CsA. (B) Quantitation of the TMRM fluorescence changes over mitochondrial regions. The quantitation was carried out as described in Experimental Procedures. The arrow indicates the time of addition of LAK extract and rGzmB. (C) Quantitation of calcein fluorescence changes over mitochondrial regions in wt and DKO MEFs. Wt and DKO MEFs were stained with calcein/Ni2+ and imaged. The quantitation of calcein fluorescence over mitochondrial regions of interest was carried out as described in Experimental Procedures. Where indicated (arrow), 15 μg of LAK extract plus 6 μg of rGzmB (solid symbols) or 200 mM arachidonic acid (ARA, open symbol) was added. In the case of ARA, only the effects on wt MEFs are shown for the sake of clarity. Identical effects were noted in the DKO MEFs.

