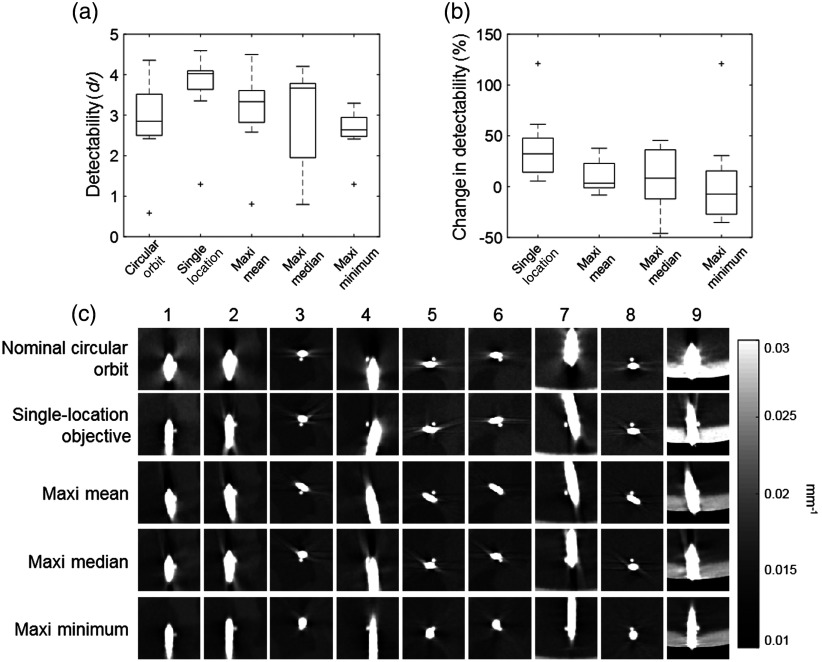
Fig. 8.
Optimization for multiple task locations. (a) Boxplots showing detectability index for the nine locations for a circular orbit, a single-location objective, maxi-mean, maxi-median, and maxi-min objective functions. On each box, the central line indicates the median, and the bottom and top edges of the box indicate the 25th and 75th percentiles, respectively. The whiskers indicate the range of the data excluding outliers, which are indicated with the “+” symbol. (b) Boxplots showing the percentage change in detectability from a nominal circular orbit after optimization at all the nine locations for the single-location objective function and the three multilocation objective functions. (c) The resulting image for each orbit in a region around each stimulus location, demonstrating improved visualization of small spheres placed adjacent to a high-contrast cylindrical “needle.” Corresponding images from a nominal circular orbit are shown for comparison in the top row.

