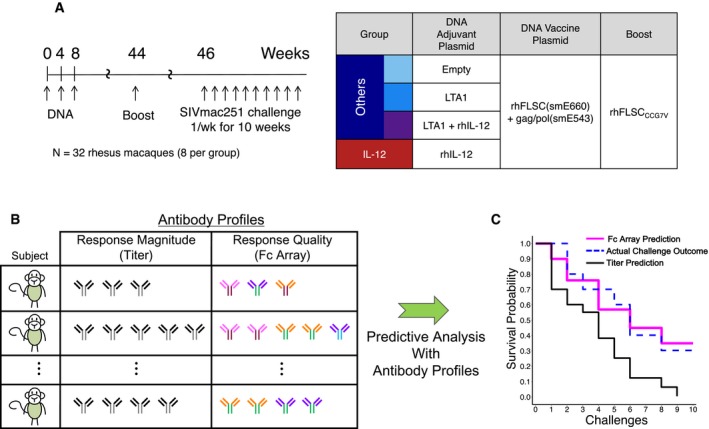
Figure 1. Schematic overview for comparison of the predictive power of antibody response magnitude versus response quality data.

- Overview of the vaccine regimen (adapted from Fouts et al, 2015).
- Antibody profiles of subjects are assayed, post‐vaccination but pre‐challenge, capturing either response magnitude alone (quantity, titer) or Fab and Fc properties (quality, Fc Array). These profiles are input into a predictive analysis framework that trains models to predict a subject's risk of infection based on antibody profile.
- The accuracy of the models is evaluated by making predictions for subjects not used in model training and comparing observed infection rates (blue dashed) to predictions, according to the models based on the two different antibody profile types (Fc Array in pink and titer in black).
