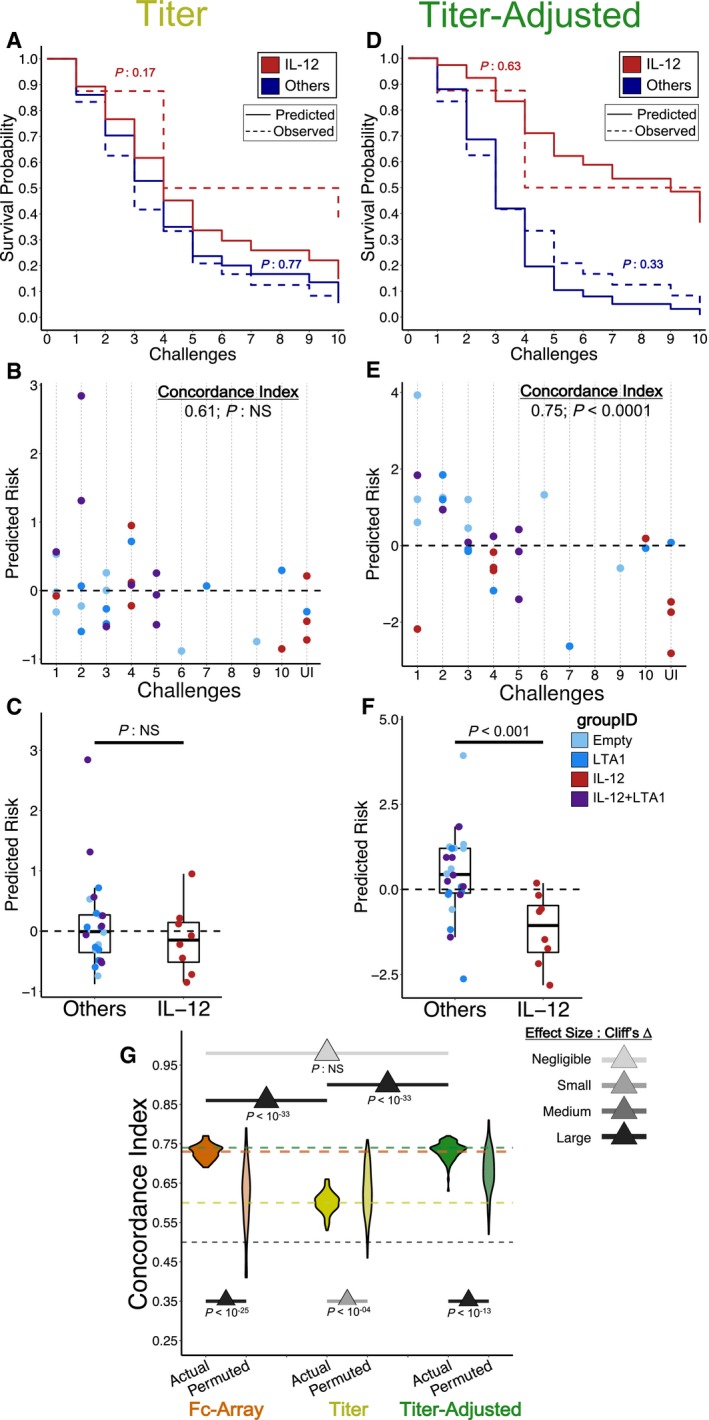
Figure 3. Robust protection modeling depends on antibody qualities beyond titer.

-
A–FModels were trained using either (A–C) titer features or (D–F) titer‐adjusted features. (A & D) Observed KM curves and predicted survival probabilities. The predicted (solid) curves for the model using titer features (A) are significantly different from the observed (dashed) ones, while those for the model using titer‐adjusted features (D) are not (log‐rank test). (B & E) Observed time‐to‐infection versus predicted risk of infection according to representative eightfold cross‐validation runs. Predictions from the titer‐adjusted model (E) are much more concordant with observation (C‐index) than those from the titer model (B). (C & F) Group‐wise differences in predicted risk of infection from the representative eightfold cross‐validation runs. The titer model (C) does not predict the observed difference in protection between groups (Wilcoxon–Mann–Whitney), while the titer‐adjusted one does (F). n = 8 for IL‐12 and n = 24 for Others.
-
GC‐indices from repeated cross‐validation and permutation testing, using the three different sets of features. Titer‐adjusted data maintain substantial (Cliff's Δ) difference between using the actual data and the permuted data. There are also significant (tail probability) and substantial (Cliff's Δ) differences between titer‐only cross‐validation results and others, but not between the original Fc Array data and titer‐adjusted data. The pair‐wise comparison between actual models using three feature sets was done by measuring the tail probability of the mean of one distribution with respect to the other. The horizontal lines represent the mean C‐index for each data type and for random prediction (0.5). One hundred repetitions of 8‐fold cross‐validation.
