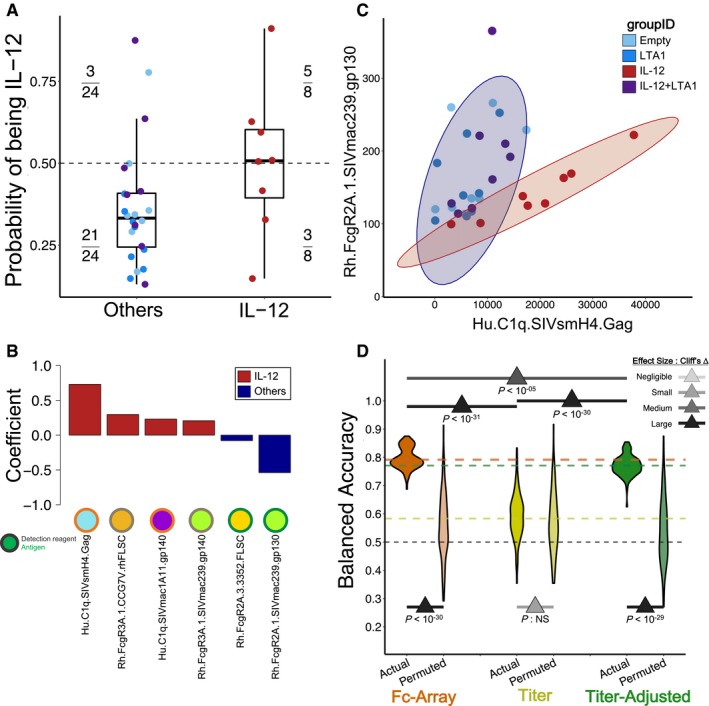
Figure 4. Antibody profiles distinguish IL‐12 adjuvant‐specific responses from others.

- Predicted probability of being in the IL‐12 group according to the binomial logistic classifier in the representative eightfold cross‐validation run. Three animals (points, colored by group) from the combined other adjuvant groups are predicted to be members of the IL‐12 group (above the 0.5 decision boundary, dashed line), and likewise 3 out of 8 IL‐12 animals are misclassified as belonging to the “others” group. n = 8 for IL‐12 and n = 24 for Others.
- The final model classified animals into groups based on a linear combination of a small set of features associated with the IL‐12 group (positive coefficients, red) vs. others (negative, blue).
- Two of the features in the final model clearly separate the other groups.
- Classifiers obtain robust performance using the original Fc Array features or the titer‐adjusted features, but not the titer‐only features, as revealed by tests of significance (tail probabilities) and magnitude (Cliff's Δ) in results from repeated cross‐validation and from permutation. The pair‐wise comparison between actual models using three feature sets was done by measuring the tail probability of the mean of one distribution with respect to the other. One hundred repetitions of 8‐fold cross‐validation.
