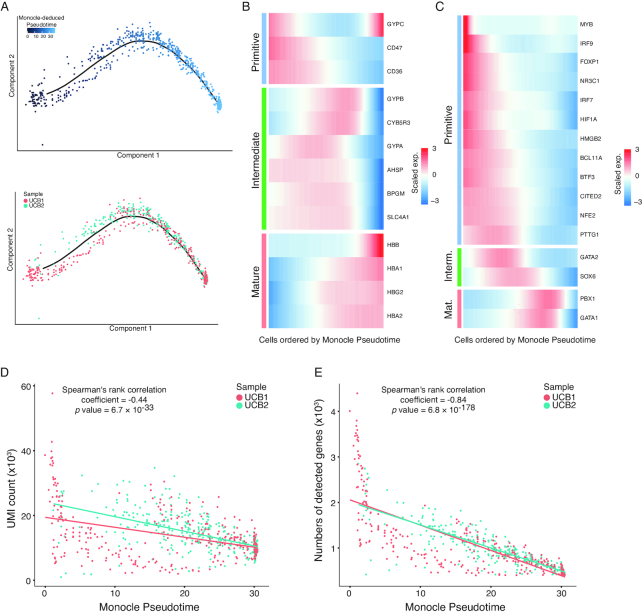
Figure 2:
Polarity of nucleated red blood cells in the UCB samples. (A) The order of NRBCs along pseudotime in a 2D space determined by Monocle2. Each dot represents a single NRBC. Color gradient represents the pseudotemporal order in the upper panel. Cells from the 2 UCB samples are labeled in the same topology in the bottom panel. (B) Heat map of gene expression (exp.) in NRBCs ordered by pseudotime (x-axis). Three clusters of pseudotime-dependent genes are grouped into primitive stage (top), intermediate stage (middle), and mature stage (bottom). (C) Heat map of key transcription factor (TF) expression, similar to (B). (D) Numbers of detected unique molecular indices (UMIs) in each NRBC ordered by pseudotime. Each dot represents an NRBC, and the color represents the corresponding UCB sample of each cell. Y-axis represents number of detected UMIs (thousands). Overall Spearman's correlation coefficient and corresponding P values are shown at the top. (E) Numbers of detected genes in each NRBC, ordered by pseudotime. Each dot represents an NRBC, and the color represents the corresponding UCB sample of each cell. Y-axis represents the number of detected genes (thousands). Overall Spearman's correlation coefficient and corresponding P values are shown at the top.

