Figure 3.
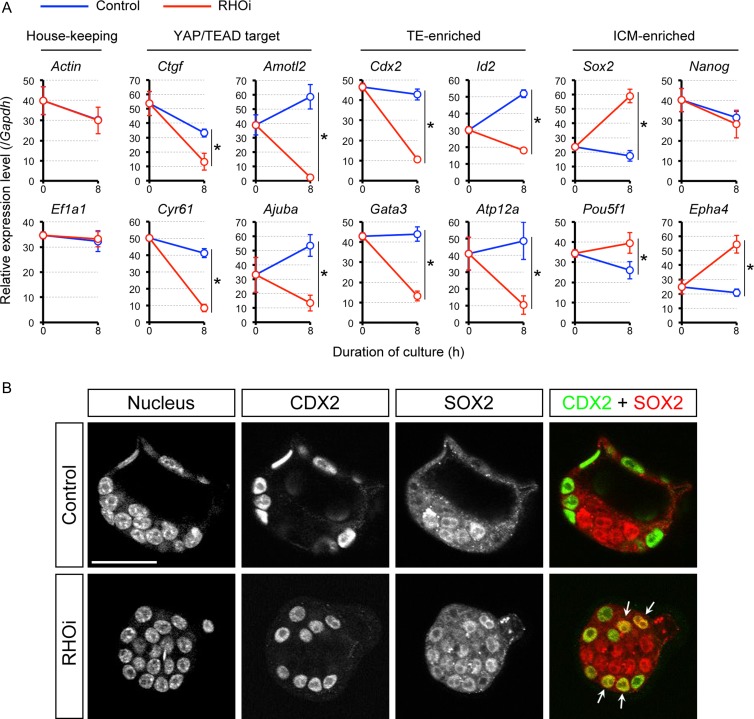
Changes in gene expression caused by RHOA inhibition in the E3.5 expanding mouse blastocysts. (A) Quantitative RT-PCR analysis of E3.5 blastocysts before (0 h) and after 8 h treatment with no inhibitor (Control) or with RHO inhibitor I (RHOi). Asterisks indicate significant differences (P < 0.05; two-sample t-test) in the relative expression levels between control and RHOi-treated blastocysts. Error bars represent SD. TE: trophectoderm. ICM: inner cell mass. (B) Optical section confocal images of nucleus, CDX2, and SOX2 in representative control (n = 9) and RHOi-treated (n = 9) blastocysts. Arrows indicate nuclei that are positive for both CDX2 and SOX2. Scale bar = 50 μm.

