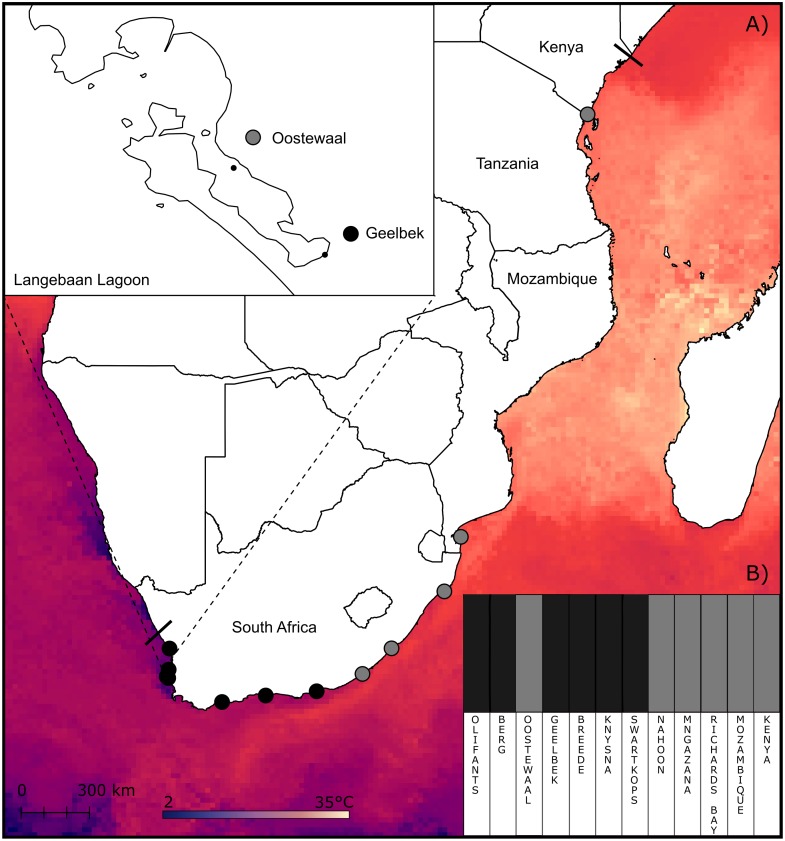
Figure 1. Sampling sites and clustering of Z. capensis populations.
(A) Map showing the sampling sites and sea surface temperature across the range of Z. capensis (indicated by the solid lines). An inset of the two sites at Langebaan Lagoon is provided. (B) Clustering analysis of the twelve sites estimated in BAPS for the complete dataset, with the twelve sites grouped into two clusters.

