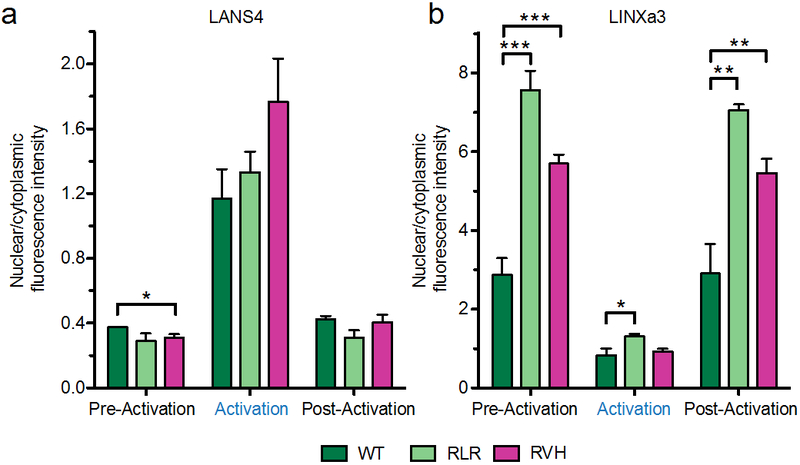
Figure 6.

Quantification of protein localization using still images from LANS4 and LINXa3 activations. Comparison of nuclear/cytoplasmic distribution of wild type, RLR, and RVH variants in LANS4 (a) and LINXa3 (b) from pre-activation, activation, and post-activation frames quantified in Figures 4b and 5b. Mean ± s.e.m. was calculated from images of multiple activations and multiple cells as in Figures 4b and 5b. *P < 0.05, **P < 0.01, and ***P < 0.001 by unpaired two-tailed t-test.
