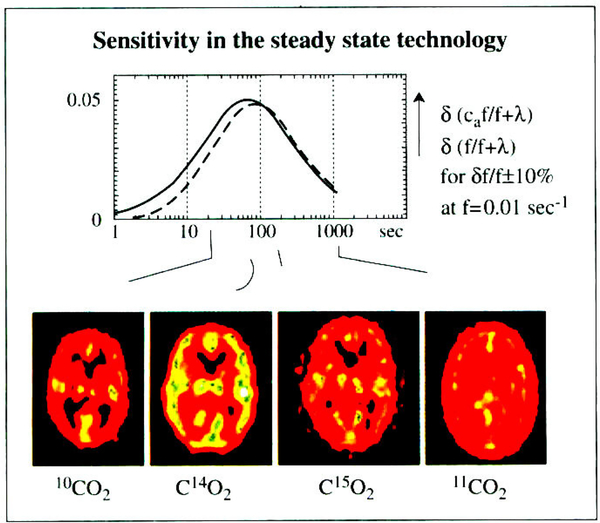
Figure 1.—
The sensitivity of the steady state technique for the measurement of regional blood flow is determined between the “impedance matching” of mass specific flow f (mL/s/gram of tissue = s−1) to the mean decay rate λ=ln 2/t1/2. The optimal half life is 71 s for grey matter flow, where a 10% variation in f would result in a 5% variation in the equilibrium activity, slightly displaced to the right when accounting for the lung-to-brain arterial delay ca(t). The PET steady state flow images of the normal subjects reflect the increased contrast at the shorter lifetime CO2 tracers.

