
Figure 5.
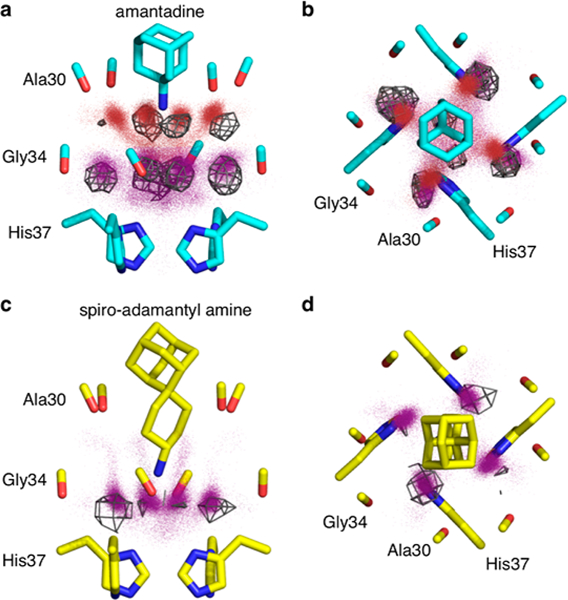
Molecular dynamics simulations reproduce the positions of the crystallographic waters. X-ray crystal structures are shown as sticks. Red and purple dots are water oxygen positions from MD snapshots of the largest amine clusters. Gray wireframe shows 1σ contours of water electron density from the X-ray crystal structure. (a, c) Side views. (b, d) Top views. Details of the simulations and treatment of the data are given in the SI.