
Figure 1. Equalization of CLL patient and HC BM cellular compartments by CD19-exclusion.
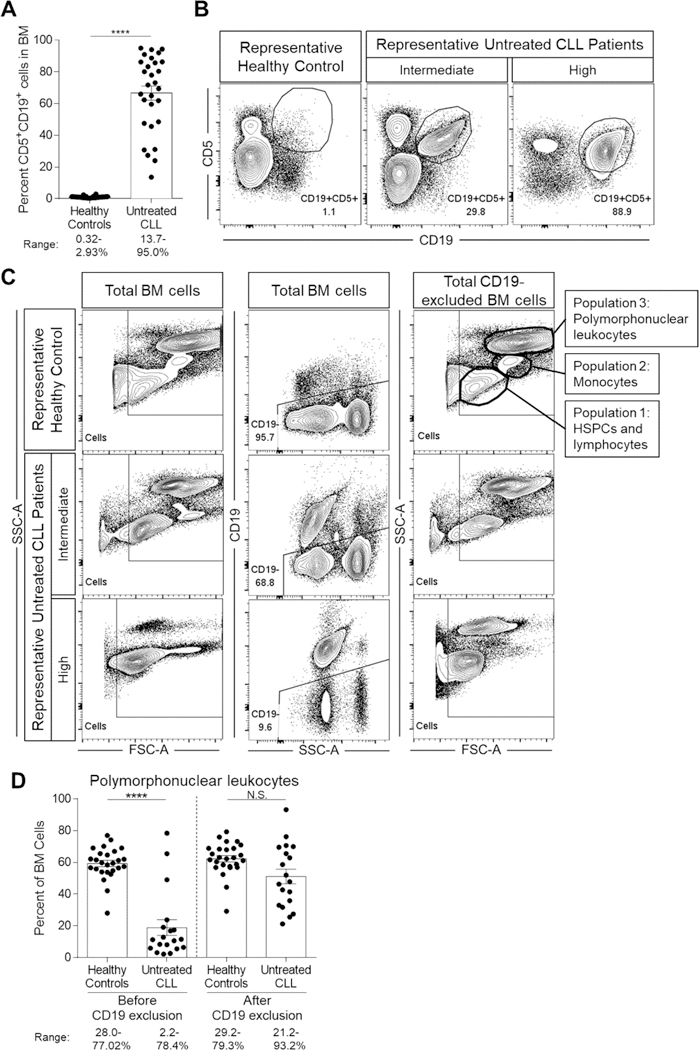
Freshly isolated ACK-lysed BM cells from CLL patients and HCs were evaluated by flow cytometry for total cellular composition and frequencies of CD19+CD5+ and CD19- cells. (A) Frequencies of CD19+CD5+ cells in CLL patient BM samples compared to HCs. HC n=34 and CLL n=29 (60 individual experiments). (B) Representative flow cytometry plots exhibiting variable CLL B cell infiltration in BM compared to a representative HC example. (C) Representative flow cytometry plots demonstrating BM cellular profiles before (left column) and after (right column) CD19-exclusion (middle column). Exclusion of all CD19+ cells, including the infiltrating CLL B cells, allows for equalization of the remaining (CD19-) BM cells. The post-CD19 exclusion HC flow cytometry plot (top right) illustrates three key cellular populations that can be identified by distinct FSC-A and SSC-A characteristics: 1) lymphocytes and HSPCs, 2) monocytes, and 3) polymorphonuclear leukocytes and granulocytes. (D) Evaluation of polymorphonuclear leukocyte frequencies in BM before and after CD19 exclusion. HC n=26 and CLL n=19 (40 individual experiments). Data in (A) and (D) is represented as the mean and SEM with each point indicating an individual BM sample. Numbers under each figure represent the range for each parameter evaluated for HCs and CLL patients. N.S. = not significant and ****P<0.0001 by Mann-Whitney U-test.