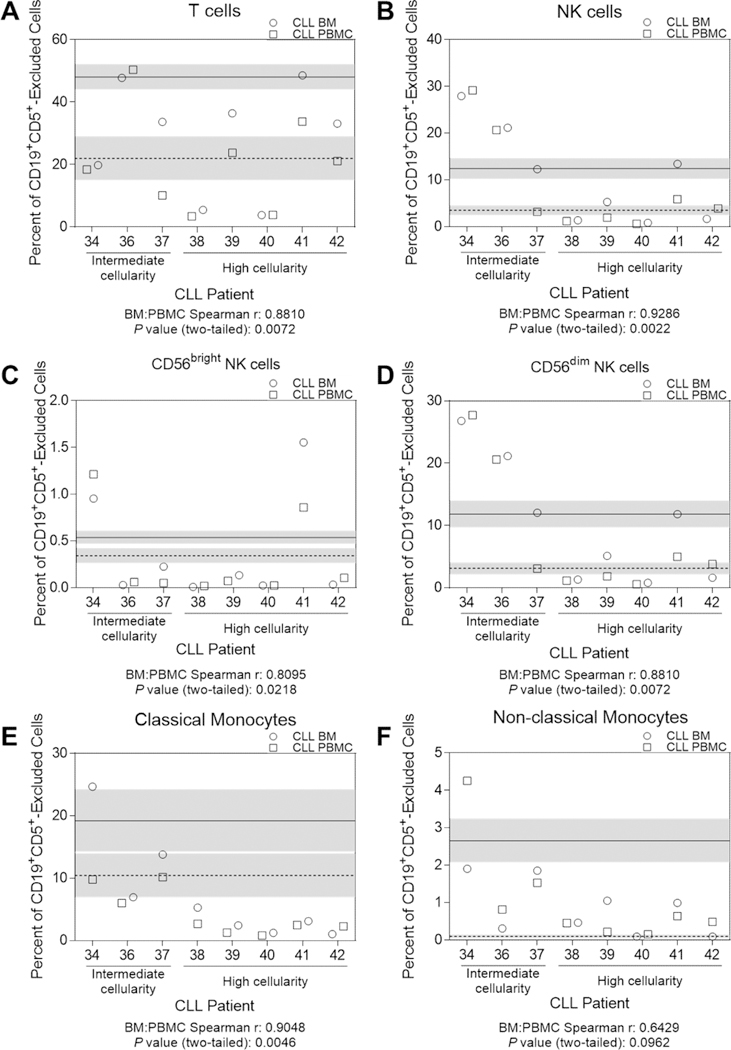
Figure 4. Comparative immune subset analysis of CLL patient blood and BM.

Previously cryopreserved paired BM and blood samples from CLL patients (total n=8, intermediate cellularity n=3 and high cellularity n=5, visit dates less than four weeks apart between BM and blood collections) and previously cryopreserved HC BM (n=7) and blood samples (n=6) (unmatched and unpaired) were evaluated by flow cytometry for frequencies of (A) T cells, (B-D) NK cells and subsets, and (E-F) monocyte subsets. All populations were gated after exclusion of infiltrating CD19+CD5+ cells. The HC BM and blood data were each averaged together for a reference value and indicated by horizontal solid (blood) or dashed (BM) lines. Shaded areas represent the SEM of the reference values. Each individual CLL patient is represented by a patient number that matches Tables 1 and S1. Cell frequencies from the BM are represented by an open circle and those from blood by an open square. See Table S3 for phenotypic definitions for each population. Correlation r and P values between BM and blood cells were determined by a Spearmen two-tailed correlation (see Figure S6). All data from one individual experiment.
