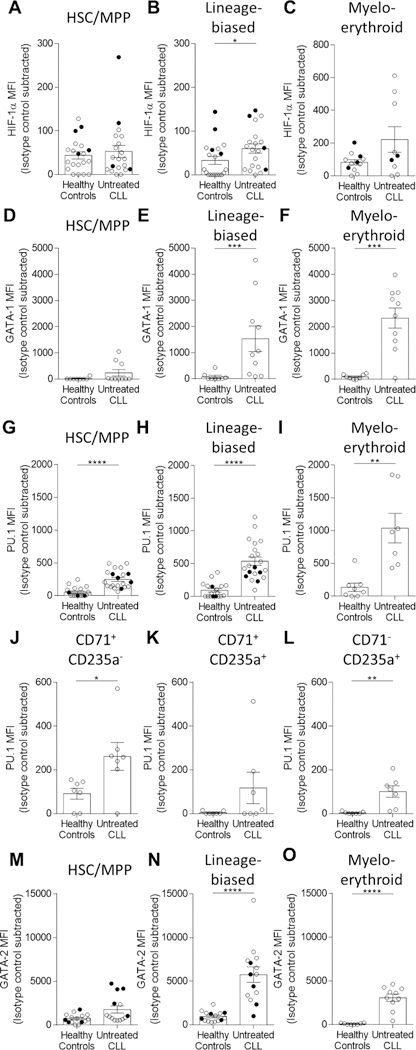
Figure 5. Alterations in transcription factor expression levels in BM HSPC subsets in CLL patients.

Fresh or frozen, thawed BM cells were analyzed for intranuclear expression of transcription factors by flow cytometry. (A-C) HIF-1α (A-B: HC n=20, CLL n=20, 10 individual experiments, C: HC n=12, CLL n=9, 7 individual experiments), (D-F) GATA-1 (HC n=8, CLL n=10, 1 individual experiment), (G-L) PU.1 (G-H: HC n=18, CLL n=21, 9 individual experiments, I: HC n=8, CLL n=7, 3 individual experiments and G-I: HC n=8, CLL n=8, 3 individual experiments), and (M-O) GATA-2 (M-N: HC n=14, CLL n=14, 4 individual experiments, O: HC n=8, CLL n=10, 1 individual experiment). Cellular populations defined as: HSC/MPP (Lin-CD19-CD34+CD38-CD45RA-), lineage-biased (Lin-CD19-CD34+CD38+), myelo-erythroid (CD19-CD33+CD71+) progenitor, and erythroid development (delineated by CD71 and CD235a) (see Table S3). MFI values for each transcription factor were subtracted against the isotype control and presented as the mean and SEM where each point indicates individual subjects. Freshly isolated samples are designated as closed symbols and previously cryopreserved samples as open symbols to allow for sample distinction. *P<0.05, **P<0.01, ***P<0.001, and ****P<0.0001 were obtained by Mann-Whitney U-test.
