Figure 10.

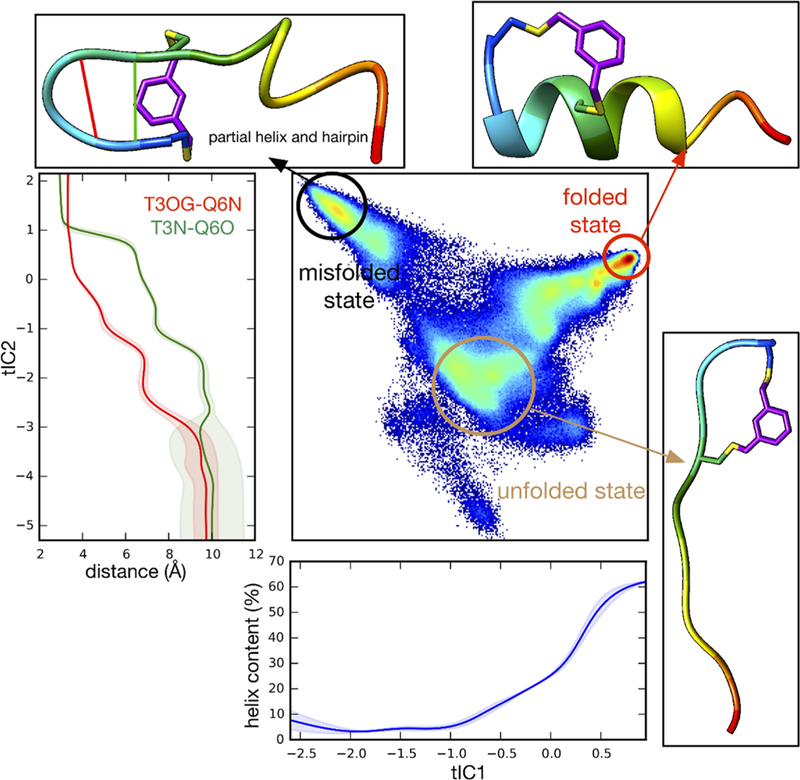
Trajectory data for N-Cap2 peptide projected to the 2D tICA landscape, along with average helix content (blue) as a function of tIC1 and average atomic distances Thr3(Oγ)−Gln6(N) (red) and Thr3(N)−Gln6(O) (green) as a function of tIC2.

Trajectory data for N-Cap2 peptide projected to the 2D tICA landscape, along with average helix content (blue) as a function of tIC1 and average atomic distances Thr3(Oγ)−Gln6(N) (red) and Thr3(N)−Gln6(O) (green) as a function of tIC2.