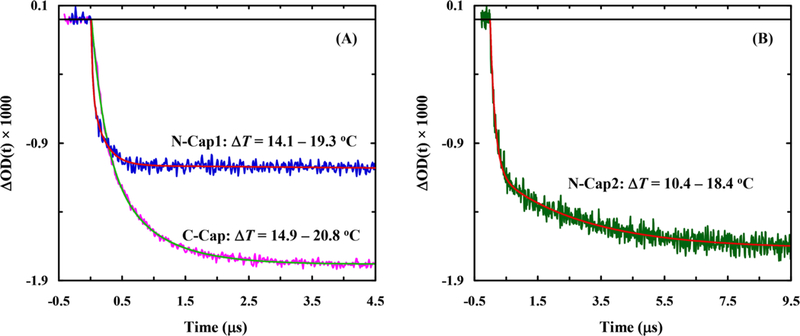
Figure 3.

Representative conformational relaxation kinetics of C-Cap and N-Cap1 (A) and N-Cap2 (B) in response to a T-jump, as indicated. In each case, the smooth line corresponds to the best fit of the respective kinetic trace to a specific decay function: ΔmOD(t) = 1.78[exp(−t/472 ns) − 1] for C-Cap, ΔmOD(t) = 1.08[exp(−t/162 ns) − 1] for N-Cap1, and ΔmOD(t) = 1.66[0.66 exp(−t/180 ns) + 0.34 exp(−t/3020 ns) − 1] for N-Cap2.
