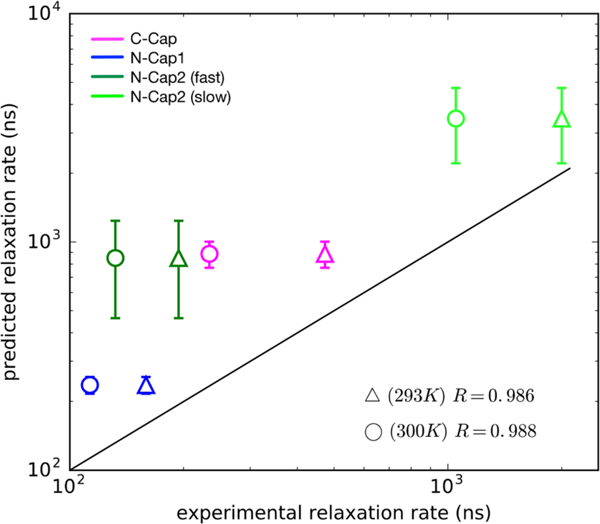
Figure 7.

Comparison between the slowest relaxation time scales predicted from MSMs and experimentally measured relaxation time scales. Experimental measurements made at ~293 and 300 K are denoted by triangles and circles, respectively. Uncertainties in the predicted values (vertical bars) were calculated using a bootstrap procedure in which 20 different MSMs were constructed by sampling the input trajectory data with replacement. Coefficients of determination (R2) calculated for the two temperatures are shown on the lower right.
