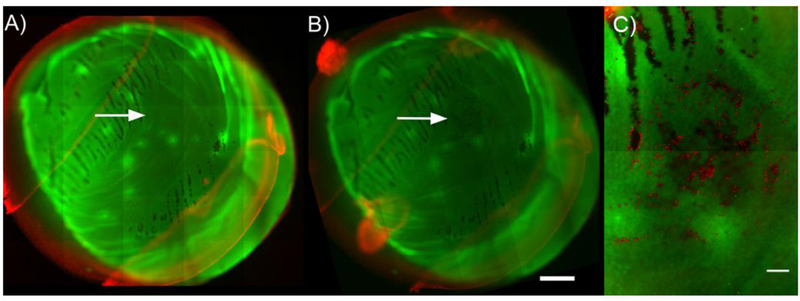
Figure 4:
Representative fluorescence image tiles of a specimen from the 9 mN indentation force group. Images A) and B) spanned the entire endothelial cell surface area (~50 mm2, ~30 – 35 image tiles) and were taken A) after dissection, staining and trephination procedures, but prior to mechanical indentation (serving as a baseline image) and B) after mechanical indentation. The indentation images taken after indentation were translated and rotated to match the alignment of the baseline image to facilitate analysis. Arrows in A) and B) indicate site of indentation. C) A third multichannel tiled (~ 2 – 4 tiles) EFI projection of a z-stack was taken at site of indentation to facilitate quantification. Each red dot is an individual dead/injured CEC labelled with PI. The resolution of images used for quantification was 995 × 710 pixels (figure resolution was 498 × 355 pixels). The scale bar in A) and B) is 1 mm; scale bar in C) is 200 μm.

