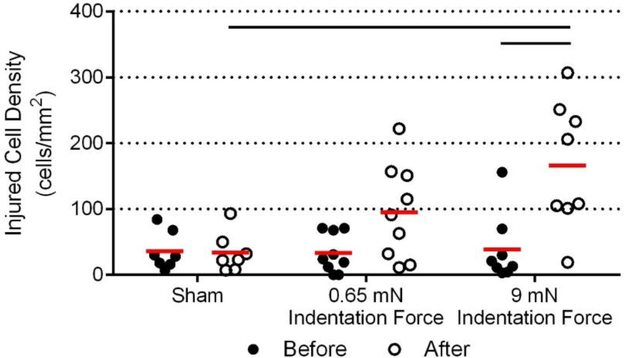
Figure 6:
Quantification of injured CEC densities within the full contact area for each experimental group before and after indentation. Mean values are denoted by the red line. CEC loss in the 9 mN indentation force group was significantly higher after indentation compared with before indentation (p ≤ 0.001) and compared to the sham negative control (p ≤ 0.001).

