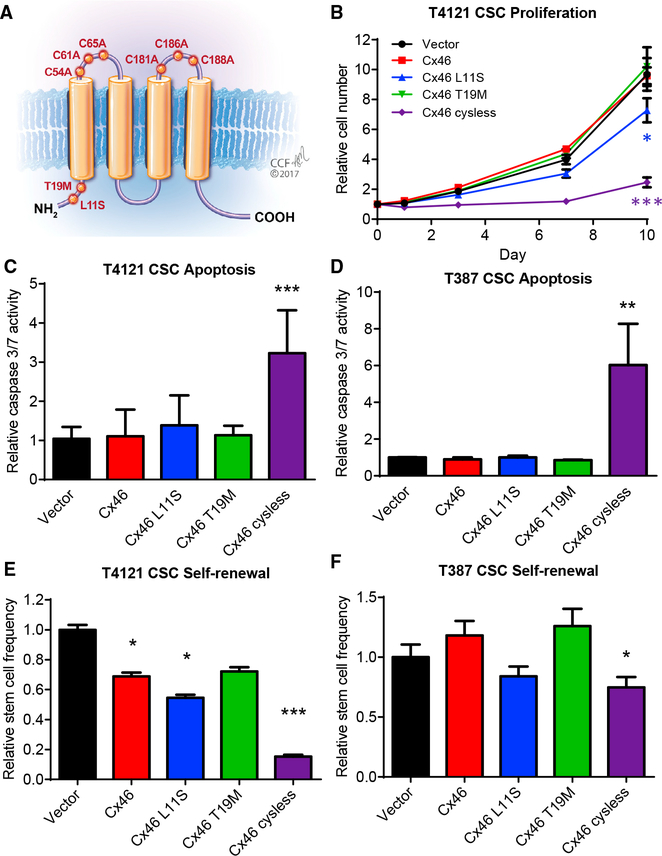
Figure 1. Mutational Analysis Indicates that Cell-Cell Communication Is Essential to Maintain Glioblastoma Cancer Stem Cells.
(A) Schematic showing the location of introduced Cx46 point mutants in the protein.
(B) CSCs from the patient-derived xenograft specimen T4121 were transfected with wild-type or mutant Cx46, and the number of cells was measured at the indicated times after plating using CellTiter-Glo. The values shown are relative to day 0. n = 4 experiments performed in triplicate. *p < 0.05, **p <0.01, ***p < 0.001 by two-way ANOVA compared to vector to test for significant differences between the curves.(C and D) Transfected CSCs from the PDX specimens T4121 (C) and T387 (D) were assessed for active caspase-3/7 on day 1 using Caspase-Glo. The values shown are normalized to the CellTiter-Glo signal at day 1 and are given relative to vector. n = 4 experiments for T4121 and n = 3 for T387, all performed in triplicate. *p < 0.05, **p < 0.01, ***p <0.001 by Student’s unpaired t test with Welch’s correction compared to vector.(E and F) Transfected CSCs from the patient-derived xenograft specimens T4121 (E) and T387 (F) were plated in a limiting-dilution format (between 1 and 20 cells/well of a 96-well plate), and the number of spheres per well was counted between days 10 and 14. The stem cell frequency was calculated using the online algorithm described in the STAR Methods section. The values shown are relative to the stem cell frequency of the vector-transfected cells. n = 3 experiments, with 24 technical replicates per cell number per experiment. *p < 0.05, **p < 0.01, ***p <0.001 by c2 test compared to the vector control. Data are represented as mean ± SEM for (B)–(D) and mean ± range for (E) and (F).
See also Figure S1.

