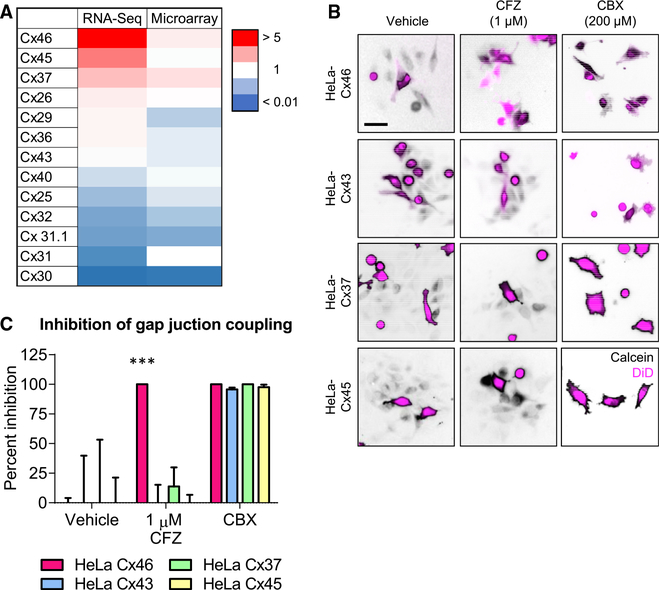
Figure 3. Cx46 Is More Sensitive Than Other Connexins Expressed in GBM to Inhibition by Clofazimine.
(A) Heatmap of connexin mRNA expression in GBM compared to normal brain tissue by both RNA sequencing and microarray. Data are from The Cancer Genome Atlas (TCGA) and were obtained from GlioVis. Red indicates higher expression compared to normal brain, while blue indicates lower expression than normal brain tissue.
(B) Parachute dye transfer assay of HeLa cells expressing different connexin proteins. HeLa cells were transfected with connexin proteins, unlabeled cells were plated in a subconfluent monolayer, and cells dual labeled with Vybrant DiD (shown in magenta) and calcein red-orange AM (shown in black) were treated with DMSO, 1 mM clofazimine (CFZ), or 200 mM carbenoxolone (CBX) for 3 h and added to the unlabeled cells. The presence of calcein dye (black) in cells that are not magenta indicates GJIC. Scale bar, 50 μm.
(C) Quantification of (B). The percent inhibition of GJIC with clofazimine is shown compared to that of vehicle and the pan-gap-junction inhibitor CBX. ***p < 0.001 by unpaired Student’s t test with Welch’s correction compared to the DMSO-treated control. Data are represented as mean ± SEM. n = 3.

