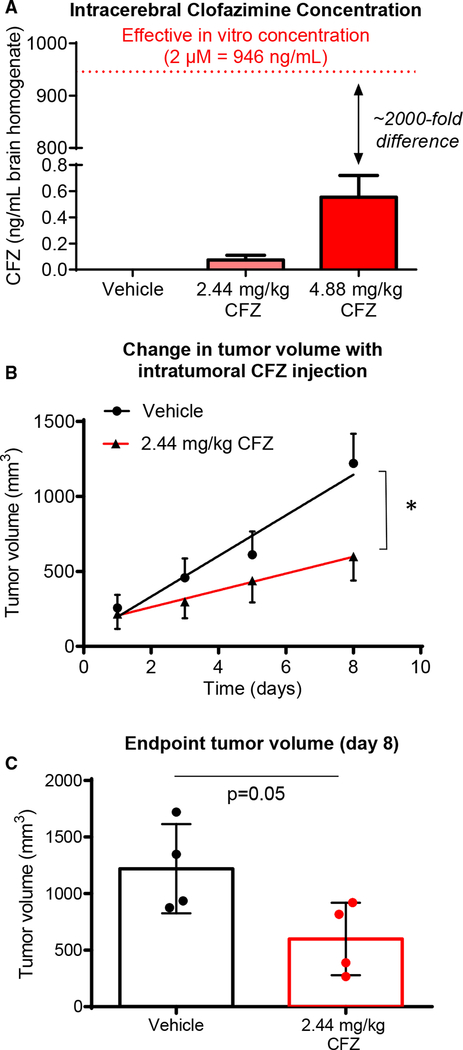
Figure 5. Clofazimine Decreases Tumor Growth In Vivo.
(A) Male and female (n = 4 each) NOD.Cg-PrkdcscidIl2rgtm1Wjl/SzJ (NSG) mice were treated with clofazimine (CFZ) at 2.44 or 4.88 mg/kg in 200 mL of corn oil by intraperitoneal (IP) injection daily for 2 weeks under a treatment plan of 5 days on, 2 days off, and 5 days on the treatment. On day 12, animals were euthanized, and brains were homogenized in PBS and subjected to mass spectrometry for clofazimine. Data are shown as mean ± SEM.
(B) (B and C) Male NSG mice (n = 4 per arm) were injected with 5 3 105 T4121 CSCs into their right flanks. Four weeks later, when tumors became palpable, animals were treated daily with clofazimine at 2.44 mg/kg in 10 mL of corn oil injected directly into the tumor for 8 days. Tumor size was measured using digital calipers, and the change in tumor volume over time (B) and the final tumor volume (C) are provided. *p < 0.05 by two-way ANOVA to test for differences between the curves in (B). The p value for (C) was generated using Student’s t test with Welch’s correction.
The data are shown as the mean ± SEM (B) or SD (C), and for (C), all data points are shown. See also Figure S4.

