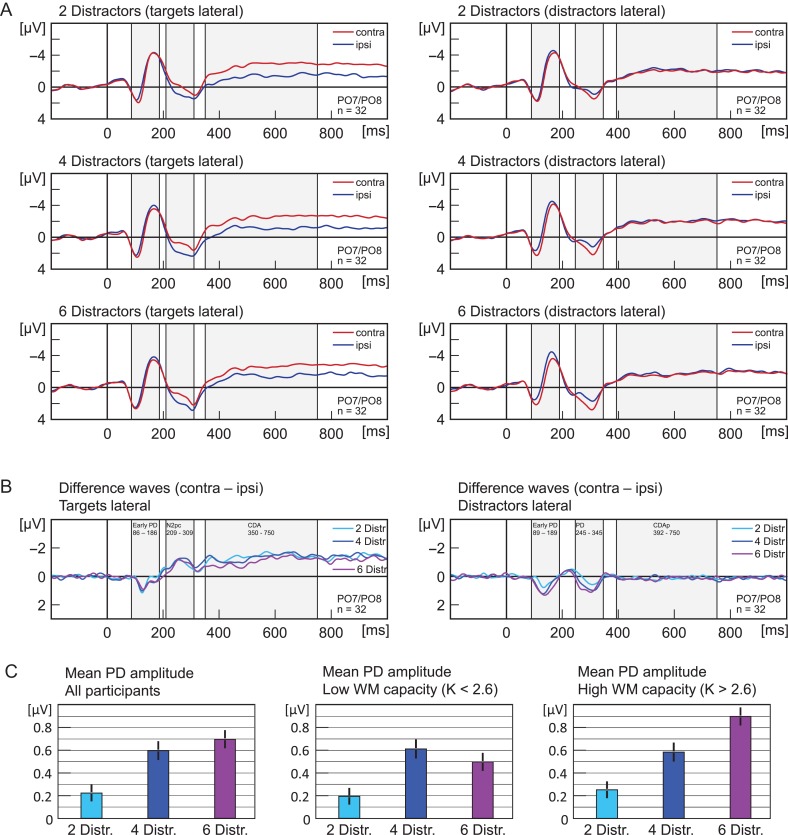
Figure 3.
(A) Experiment 2. Grand average ERPs recorded at PO7/PO8, elicited by memory displays with lateral targets (left panels) and lateral distractors (right panels). Upper panels show activity in trials with 2 distractors, middle panels for 4 distractors, and lower panels for 6 distractors. Red lines reflect activity contralateral and blue lines activity ipsilateral to the lateralized items. Grey shades indicate the analysis time window that was used to calculate mean amplitude of ERP components (N2pc, early PD, PD, CDA, CDAp). (B) Shows the same data as (A) but as difference waves (contra minus ipsi). (C) Shows the mean amplitude for the PD. Error bars indicate the standard error of the mean (corrected for individual differences; Cousineau 2005). Light blue indicates lateralized activity for trials with 2 distractors, dark blue for 4 distractors, and purple for 6 distractors. All waveforms were low-pass filtered at 30 Hz (half power cutoff, 24 dB) using digital filtering.

