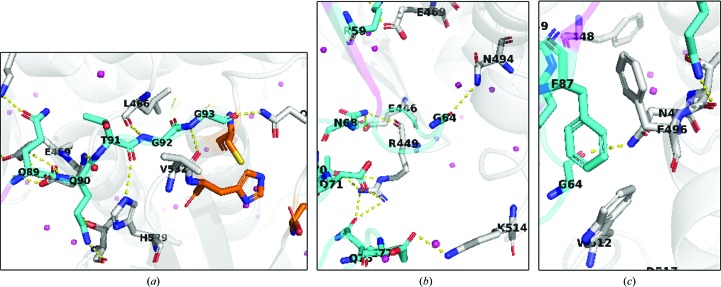
Figure 3.
The SENP1–SUMO2 interaction interface is comprised of important polar interactions (a, b) and potential hydrophobic contacts (c). In all cases SUMO2 is shown in cyan while SENP1 in shown in gray. N atoms are shown in blue, O atoms in red and S atoms in yellow. The catalytic triad residues of SENP1 are displayed in orange. Water molecules are shown as pink spheres.

