Figure 7.
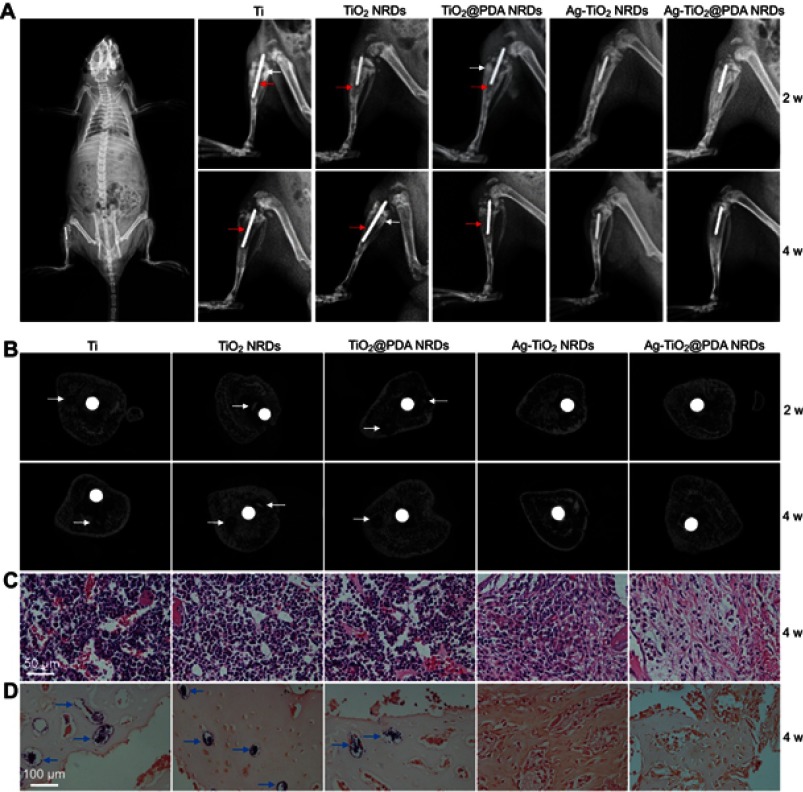
Implant infection model in vivo. (A) X-ray examination of the osteomyelitis model implanted with Ti rod 1 hr after surgery (left panel) and different kinds of rods at 2 weeks and 4 weeks (right panel), red arrows indicate osteolysis, white arrows indicate periosteal reaction; (B) cross-sectional images of micro-CT of different samples at 2 weeks and 4 weeks, white arrows indicate sequestrum; (C) H&E stain of different samples at 4 weeks (scale bars =50 μm); (D) gram stain of different samples at 4 weeks (scale bars =100 μm), blue arrows indicate MRSA colonies.

