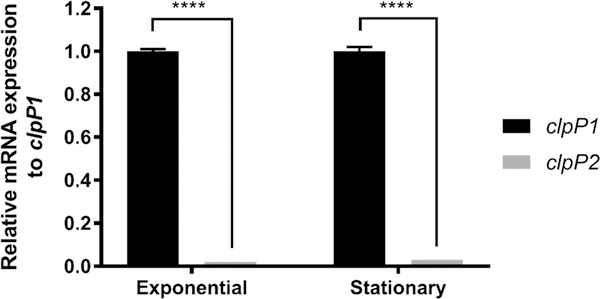
Figure 2.
Relative quantification of clpP1 and clpP2 mRNA expression during exponential and stationary growth phases in BHIS broth. Transcript levels were normalized to the reference gene rpoB, with clpP2 transcript level reported relative to clpP1. The resulting data were analyzed via multiple comparison two-way ANOVA and corrected by the Sidak method. ****, P ≤ 0.0001.

