
Figure 1.
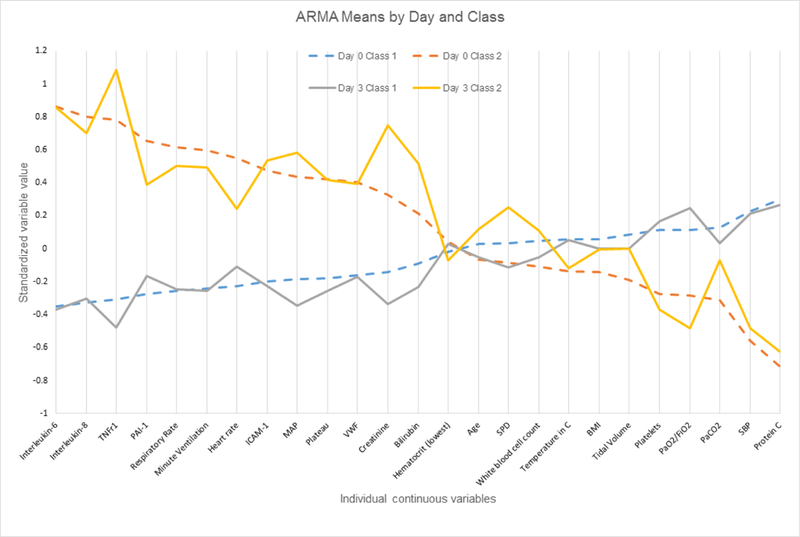
Differences in standardised values of each continuous variable by class in the ARMA cohort by day of assessment and latent class. The variables are sorted on the basis of the degree of separation between the classes at day 0, from maximum positive separation at day 0 on the left (ie, class 2 higher than class 1) to maximum negative separation at day 0 on the right (ie, class 2 lower than class 1). The y-axis represents standardised variable values, in which all means are scaled to 0 and SDs to 1. A value of +1 for the standardised variable signifies that the mean value for a given phenotype was one SD higher than the mean value in the cohort as a whole. Mean values are joined by lines to facilitate displaying class profiles. BMI, body mass index; ICAM-1, intercellular adhesion molecule-1; MAP, mean airway pressure; PaCO2, pressure of carbon dioxide in arterial blood; PAI, plasminogen activator inhibitor-1; Plateau, plateau pressure; SBP, systolic blood pressure; SPD, surfactant protein D; TNFr1, tumour necrosis factor receptor-1; VWF, von Willebrand factor.