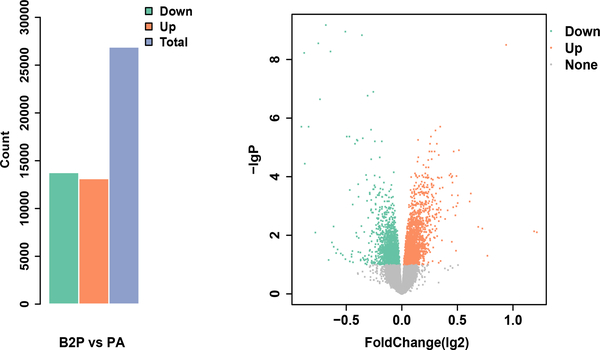
Figure 1:
Numeric statistics of differentially expressed genes whose expression was affected by β2AR-KO. a. Count of differentially expressed genes. The statistical analysis was made with DEseq. The criteria for differentially expressed genes were defined as |log2Ratio| ≥ 1 and q<0.05, where Ratio equals to fold change. b. Volcano plot showing expression levels of genes affected by β2AR-KO. PA, PS1/APP double transgenic mice. B2P, β2AR-KO PS1/APP-double transgenic mice.

