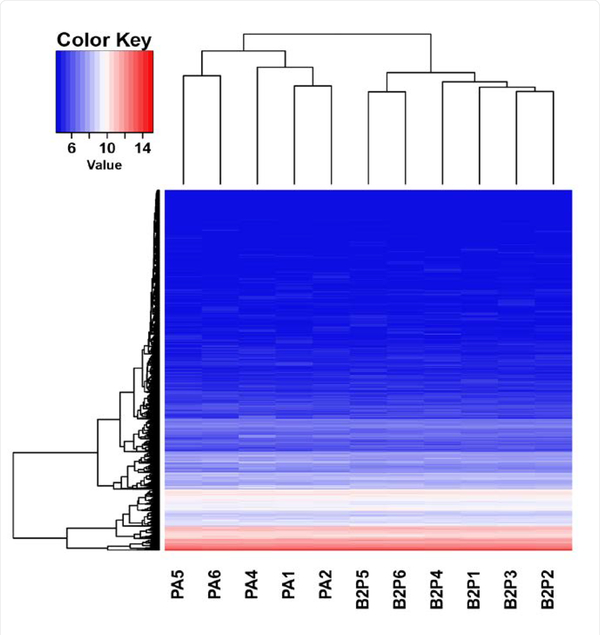
Figure 2:
Hierarchical clustering analysis for differentially expressed genes. The dendrogram on the left shows the hierarchical clustering of the genes which was made according to the Euclidean distance of Log2 values of the expression levels of the genes. The red color indicates relatively high levels of genes expression, and the blue color indicates relatively low gene expression levels. PA, PS1/APP double transgenic mice. B2P, β2AR-KO PS1/APP-double transgenic mice.

